
Most small business owners fall into one of two camps with analytics. Either they ignore them entirely — "I don't really check that" — or they obsess over the wrong numbers. Follower counts. Post likes. How many people viewed their Instagram story.
Neither approach helps you make better decisions.
The metrics that actually matter are simpler than most people think: where are customers coming from, what do they do when they arrive, and what action leads to a sale. Everything else is noise.
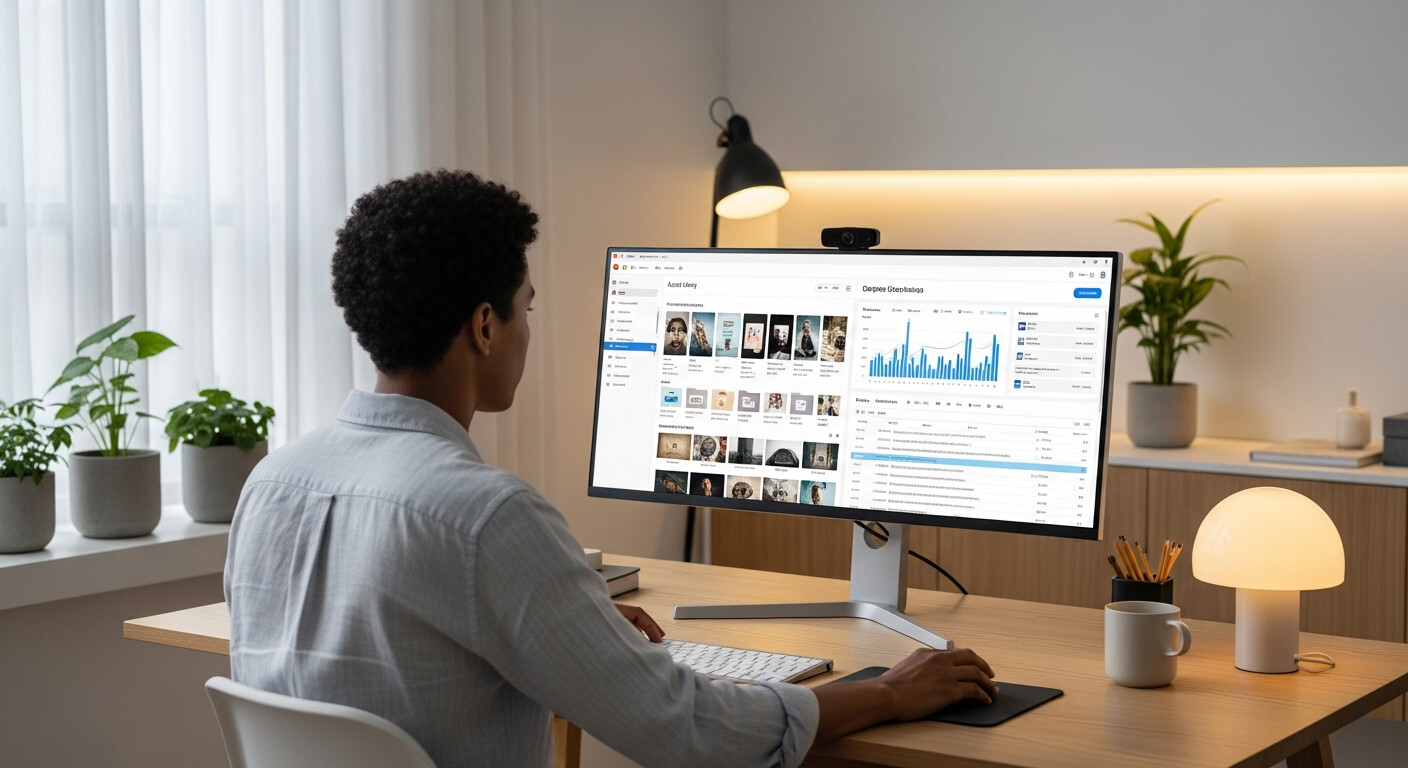
Here's what your LinkDeck analytics are telling you — and what to do with each number.
Page Views: Are People Finding You?
Your page view count tells you whether your visibility is working. If you've just printed 500 flyers with a QR code and your page views don't budge, the flyers aren't being scanned. If you post on Instagram and see a spike the same day, that's confirmation the platform is working.
The 30/60/90-day view selector matters here. A single week of data gives you noise. A 90-day trend shows you whether you're growing, flatlining, or losing visibility. Check it monthly, not daily.
Traffic Sources: Which Channel Is Actually Working
Traffic sources break down where your visitors are coming from: direct links (someone tapped your URL directly), Google search, referrals from social platforms, QR code scans tracked via UTM parameters, and other sources.
This is the most actionable data on the page — because it tells you where to spend your energy.
If 80% of your traffic comes from WhatsApp forwards, your word-of-mouth is your best marketing channel. Double down on it. Give customers something shareable. If Google is sending 40% of your visitors, your SEO is working better than you realise — protect it by keeping your content fresh.
If you've been posting on Facebook every day but Facebook sends you almost zero traffic, stop posting on Facebook every day and redirect that time somewhere that's actually working.
Device Breakdown: Know Your Audience
This one surprises people. In South Africa, upward of 90% of visits to most local business pages come from mobile phones. Not desktop. Not tablets.
If your device breakdown shows the same, it confirms something important: your page's mobile experience is what most customers see. Anything that's hard to read or tap on mobile is costing you customers.
Most LinkDeck pages are mobile-first by design. But if you've added a lot of dense text blocks or complex layouts, checking the mobile preview periodically is worth the two minutes.
Top Clicked Buttons: Your Real CTA
The top-clicked button analysis shows you which call-to-action elements on your page are actually getting used. WhatsApp? Phone number? Email? Catalogue? Book an appointment?
This tells you what customers want to do when they reach you. It's often different from what business owners assume.
A common pattern: an owner prioritises their email in the design because that's how they prefer to be contacted — but the analytics show 90% of customers tapping the WhatsApp button. The email link is being ignored. The fix is obvious: make the WhatsApp button bigger and move the email address lower.
Your analytics are literally telling you where to put your best CTA. Listen to them.
Product Analytics: Your Bestseller List in Advance
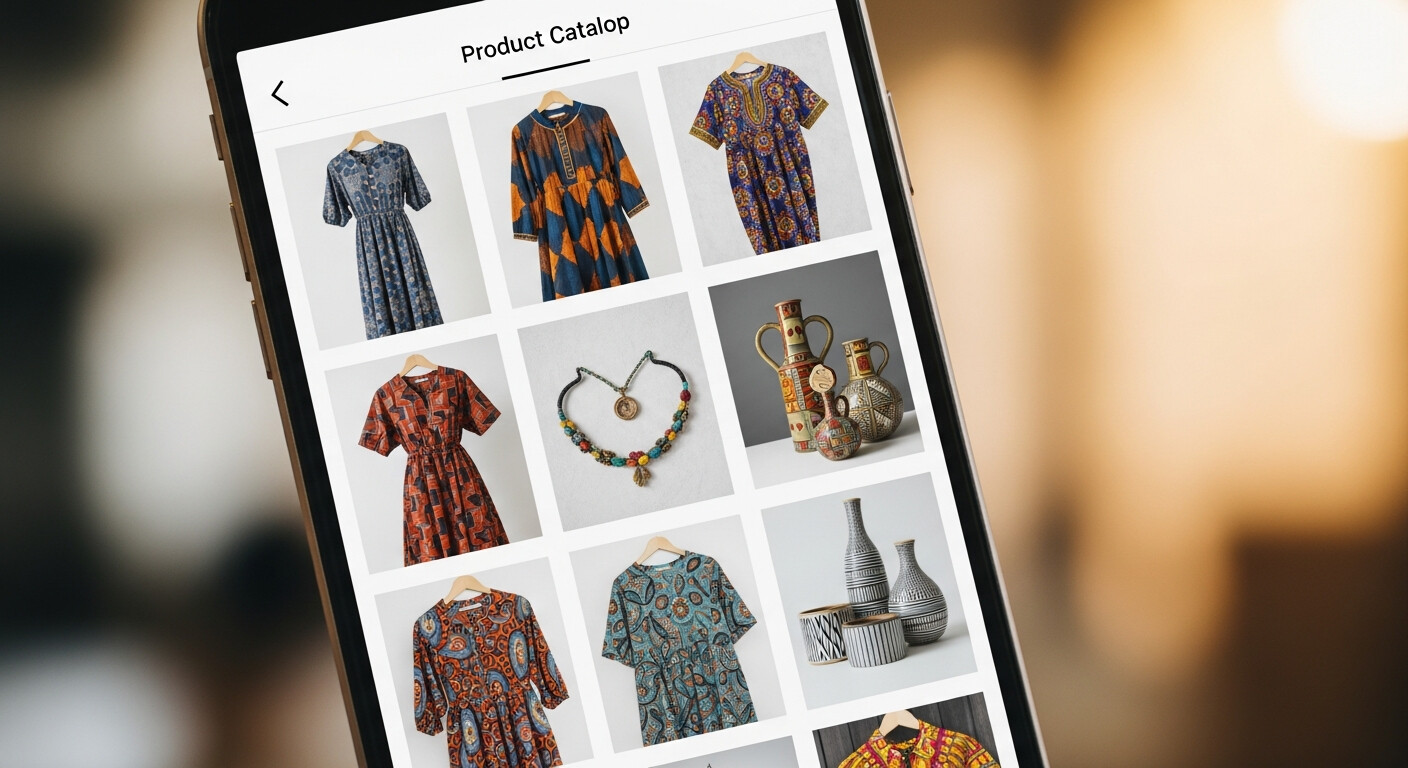
If you have a catalogue, the product analytics show you which items get the most views and which get clicked through to the enquiry or cart. This is your leading indicator.
A product with 200 views and 4 clicks has a visibility problem (people aren't interested) or a presentation problem (the thumbnail or description isn't compelling). A product with 200 views and 60 clicks is a winner — and you should consider putting it at the top of the catalogue.
Knowing this before you order stock, negotiate pricing, or plan promotions is genuinely valuable.
UTM Campaign Tracking: Measuring the Offline World
If you're running flyers, outdoor ads, vehicle wraps, or anything physical, you can add UTM parameters to your QR code URLs to see exactly how many people scanned and visited from each specific campaign.
This turns a guess ("I think the flyers worked") into a number ("The flyers drove 340 visits over six weeks"). For any business that's spending money on printed materials, this is the difference between knowing your marketing works and hoping it does.
A Real Decision Made From Data
A tutoring service in Johannesburg checked their analytics after three months and noticed two things: 78% of their traffic came from WhatsApp forwards, and the most-clicked element on the page was the phone number — not the WhatsApp button.
They made two changes: they moved the phone number higher on the page (since that's what customers wanted), and they started asking every new student to share the profile link on their school's parent WhatsApp group. Within a month, referral traffic had increased by 60%.
Nothing complicated. They read the data, made two changes, and grew.
Check It Now
Open your analytics tab. Set the window to 90 days. Look at your traffic sources, your top-clicked button, and your page views trend. Find one thing that surprises you.
That surprise is where your next improvement is hiding.